

The Art of Martec Content via a Renaissance Diagram
November 22, 2015
I love diagrams which explain content processing. I am ecstatic when a diagram explains information, artificial intelligence, and so much more. I feel as if I were a person from the Renaissance lowered into Nero’s house to see for the first time the frescos. Revelation. Perhaps this diagram points to a modern day Leonardo.
Navigate to “Marketing Data Technology: Making Sense of the Puzzle.” I admire the notion that marketing technology produces data. I love that tracking stuff, the spyware, the malware, and the rest of the goodies sales professionals use to craft their masterpieces. The idea that the data comprise a puzzle is a stroke of brilliance.
How does one convert data into a sale? Martec, marcom, or some other mar on one’s life?
Here’s the diagram. You can view a larger size at this link:
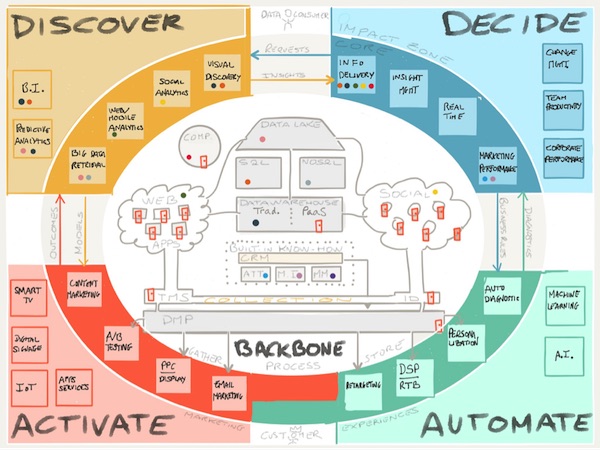
Notice the “space” is divided into four areas: discover, decide, activate, and automate. Notice that there are many functions in each area; for example, divide includes information delivery, insight real time, and marketing performance. Then notice that the diagram includes a complex diagram with a backbone, a data lake, the Web social media, and acronyms which mean nothing to me. There are like the artistic flourishes on the that hack’s paintings in the Sistine Chapel. The touches delight the eye, but no one cares about the details.
Now, I presume, you know how to make sense of the martec puzzle.
I find this type of diagram entertaining. I am not sure if it is a doodle or the Theory of Relativity for marketing professionals. Check out the original. I am still chuckling.
Stephen E Arnold, November 22, 2015
Comments
-

- Subscribe to Beyond Search
Feature archive
News archive

-