

SAP: Statistics Need Sizzle
February 22, 2016
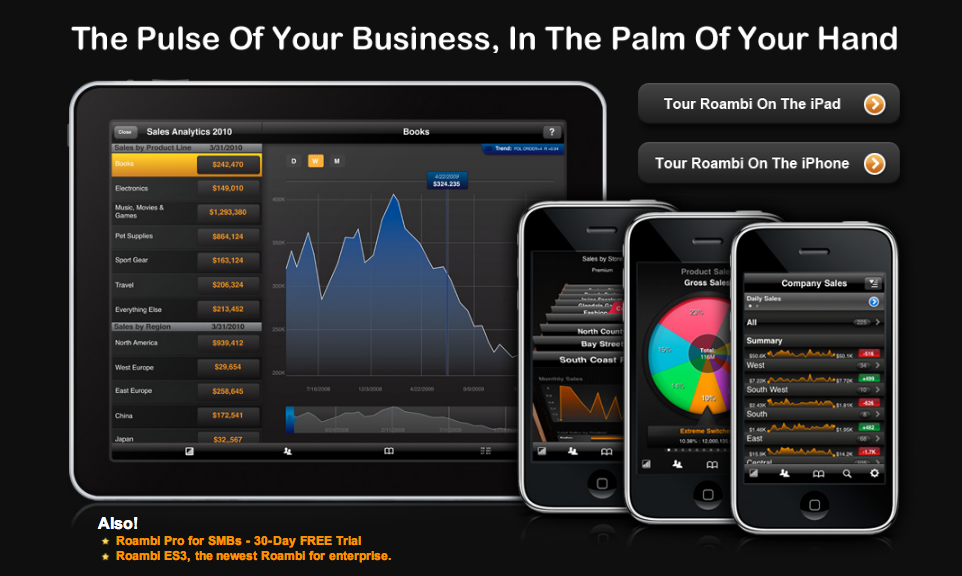
The underlying data? Important, yeah, but the action is Hollywood style graphics. Taking a page from the Palantir game plan, SAP is getting with the visual sizzle program. Navigate to “SAP Buys All the Pretty Data Firm Roambi.” The article states:
The data prettifier’s angle is it that displays data using deliciously slick and dynamically updating charts, graphs and sliders that are native apps for iOS and Android. Roambi’s front ends tap into back ends including Excel, SQL Server, Cognos, Box, Salesforce and – yes – SAP.
Special effects matter in videos, Web pages, and business analytics.
What if the analyst gets the underlying data out of joint? What if the person using the graphic output does not understand what analytic choices were made to give the visual some zing?
What? Who worries about details? It is the visual snap that crackles.
Stephen E Arnold, February 22, 2016
Comments
-

- Subscribe to Beyond Search
Feature archive
News archive

-